We had about 100 visitors in all, which is about 25 times more people finding out about the research than would read a journal article (although we are going to satisfy our lords and masters demand for one ;-) ). This was one of the motivations for running the event. Skaters are frequently depicted as the troublesome youth, so along with feeding back our findings we wanted to try and lend some legitimacy to the way they use the city, and offer support to those who back skateboarders.
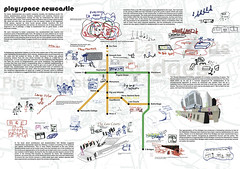
Given the nature of the research methodology (asking skateboarders to map their Newcastle), and the accessibility of visual outputs we decided to turn Adam's dissertation into an infographic (which you can see below). We had it printed at A0 for display and some smaller A3 versions to give away.

Larger and full size versions are available on Flickr
No comments:
Post a Comment